The Bitcoin Lottery Solution
Summary
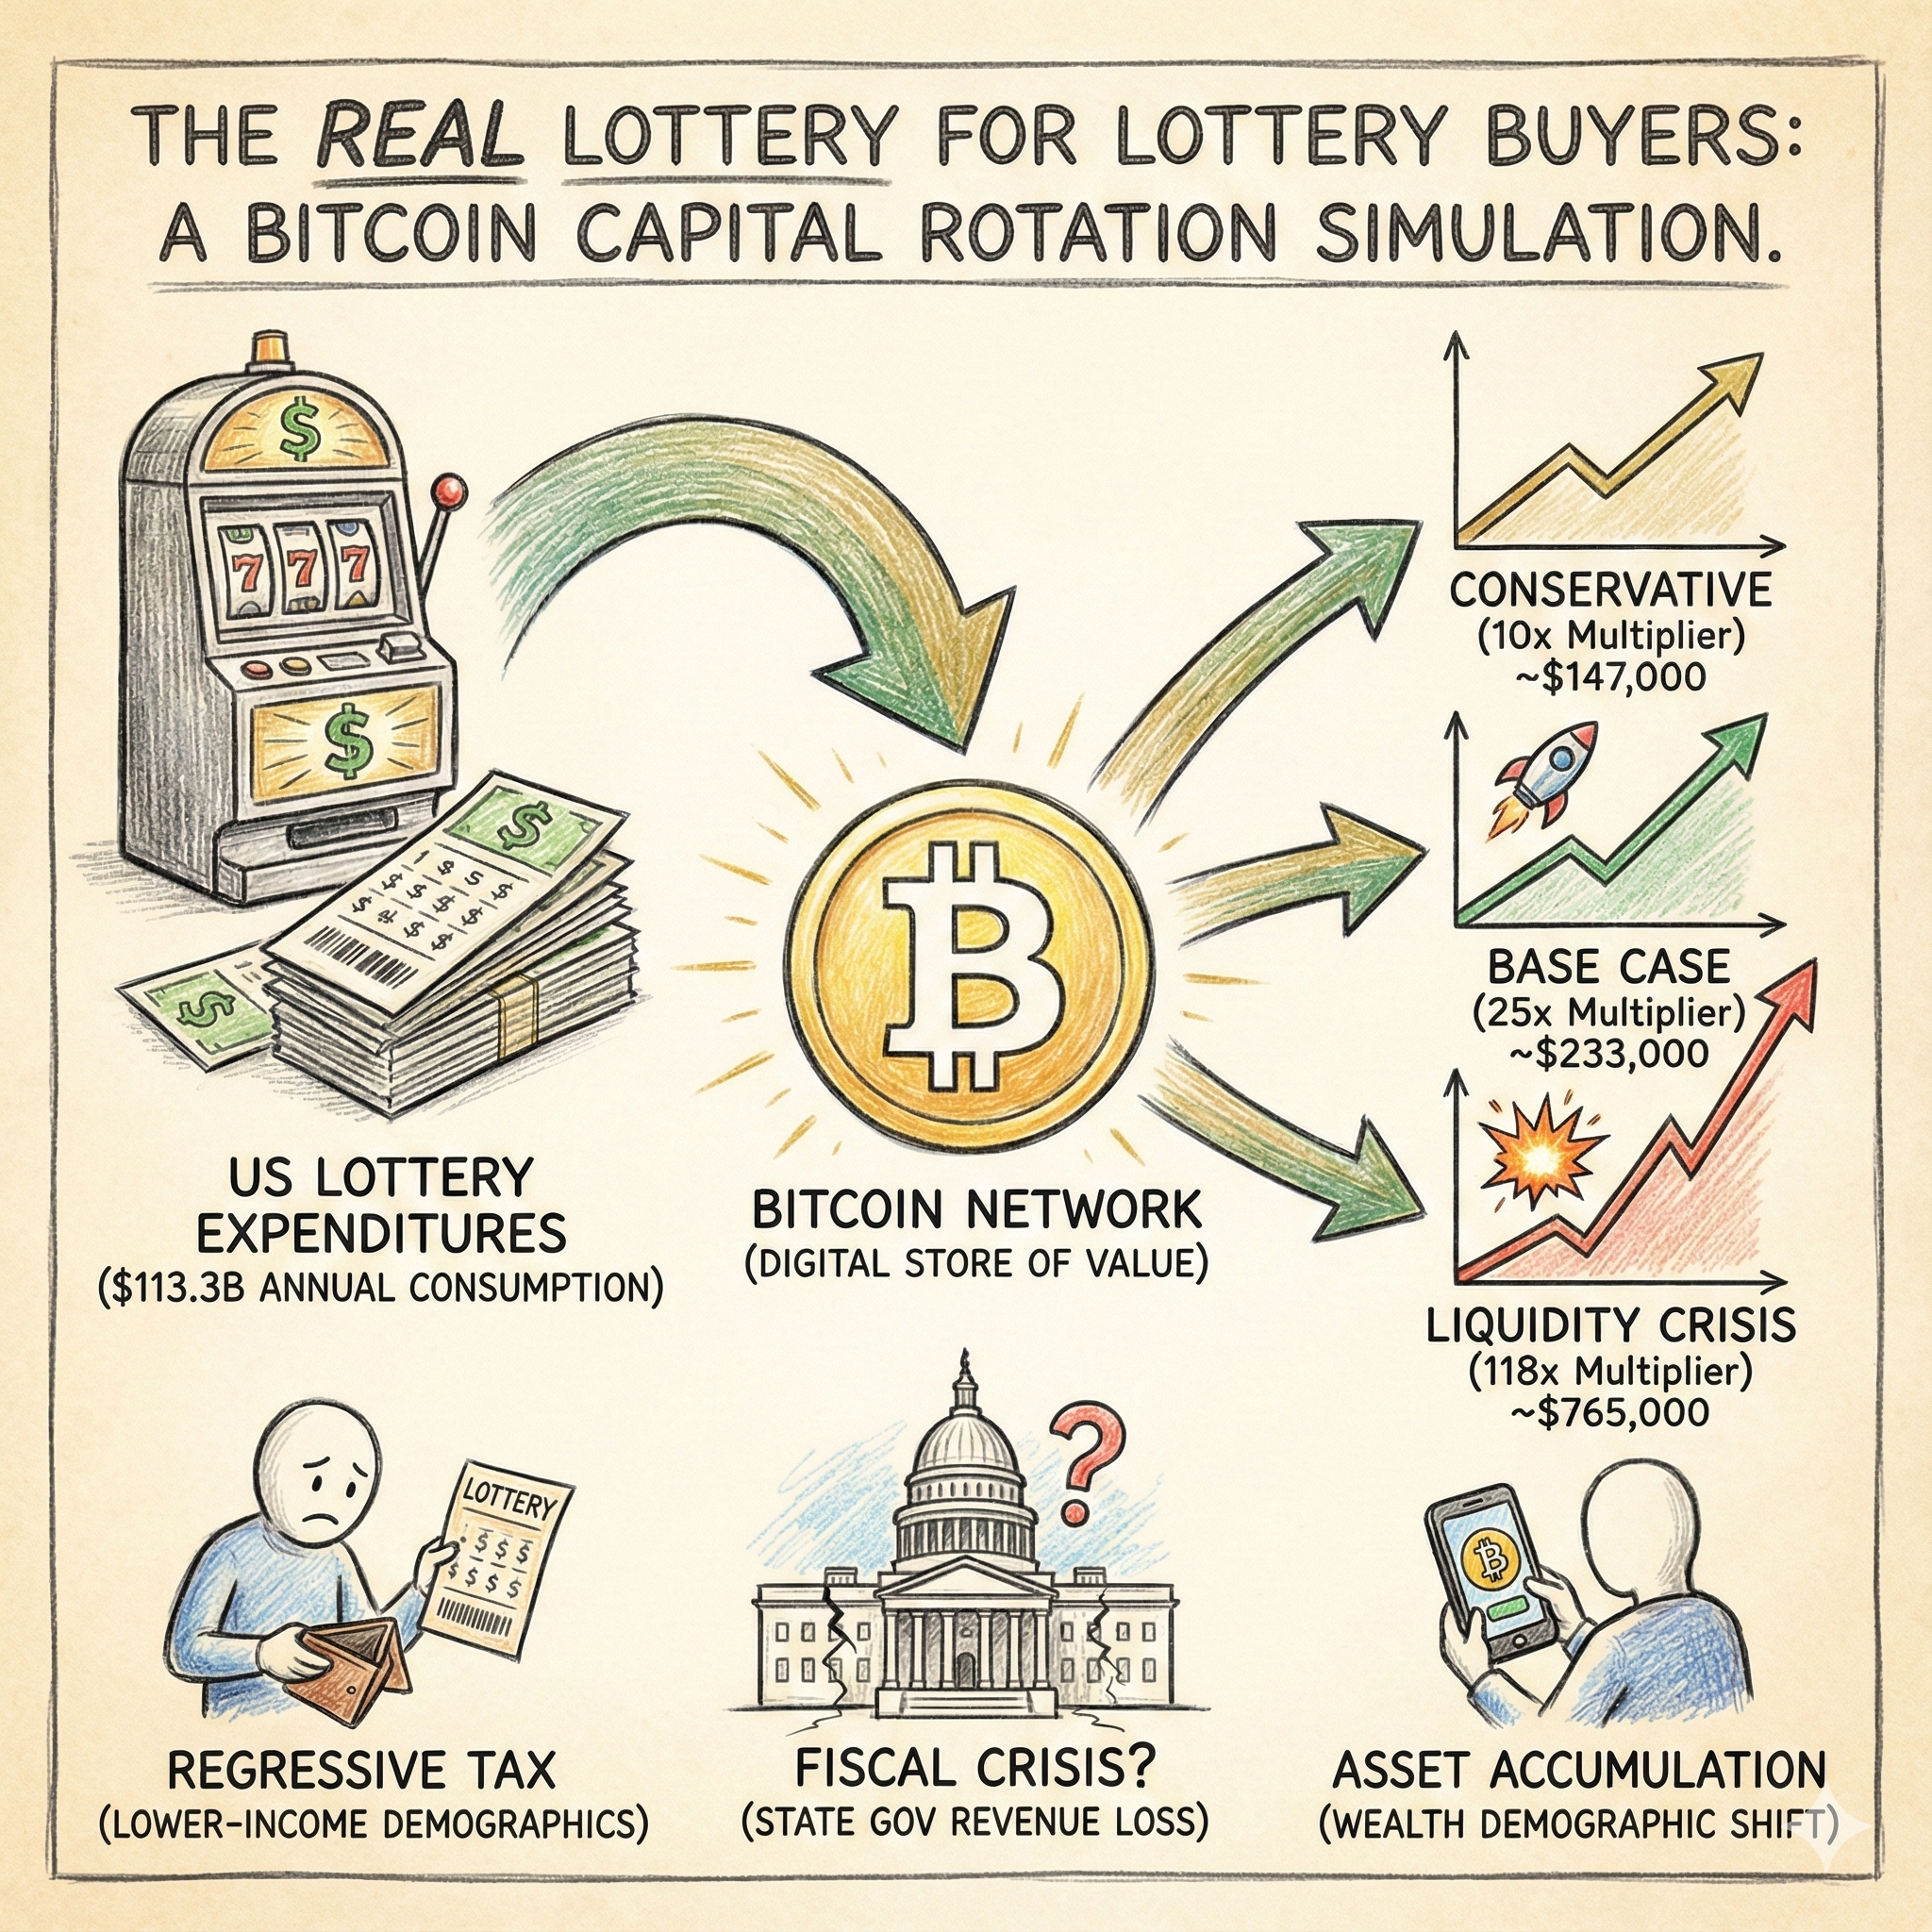
This report presents a comprehensive economic simulation and impact analysis regarding a hypothetical, systemic capital rotation: the redirection of aggregate United States lottery expenditures into the Bitcoin network. The premise involves the reallocation of approximately \113.3 billion USD in annual gross lottery sales—a sum currently categorized as consumption—into Bitcoin, a digital store of value.
The simulation reveals that such a reallocation would constitute one of the largest retail-driven capital inflows in the history of financial markets, fundamentally altering Bitcoin’s price discovery mechanism, market structure, and the wealth demographic of the American populace.
Key Findings:
- Magnitude of Capital: The US lottery system processed \113.3 billion USD in sales in FY2024.1 This flow is characterized by high velocity and inelastic demand. Diverting this capital to Bitcoin represents a daily buying pressure of approximately \310 million USD, roughly 7.6 times the daily issuance of new Bitcoin mined post-2024 halving.
- The Multiplier Effect: Utilizing liquidity sensitivity models from Bank of America, CoinShares, and Glassnode, this report projects that the impact of this inflow would not be linear (1:1) but exponential. The “Crypto Multiplier” suggests that for every \1 USD entered, the market capitalization rises by \10 USD to \118. USD
- Conservative Scenario (10x Multiplier): Bitcoin price appreciates to approximately \147,000 USD within the first year.
- Base Case (25x Multiplier): Bitcoin price reaches \233,000, USD driven by “supply shock” dynamics similar to those observed during spot ETF launches.
- Liquidity Crisis Scenario (118x Multiplier): An extreme illiquidity event drives prices toward \765,000, USD as inelastic retail demand collides with inelastic supply.
- “Just in USA” Arbitrage: While the buying pressure originates solely within the United States, the fungibility of Bitcoin ensures global price impact. However, the intensity of US-centric demand would likely create a persistent “Coinbase Premium,” where US spot prices trade higher than global averages, incentivizing massive arbitrage flows that drain Bitcoin from international markets into US custody.
- Socioeconomic Transformation: This rotation would effectively convert the “regressive tax” of lotteries—which disproportionately affects lower-income demographics—into a vehicle for asset accumulation. However, it would simultaneously create a fiscal crisis for state governments, which currently rely on ~\30 billion USD in annual net lottery proceeds to fund education and infrastructure.2
The following sections detail the granular mechanics of this rotation, utilizing on-chain data, state-level fiscal reports, and liquidity modeling.
1. The US Lottery Economy: A Forensic Accounting of \113.3 USD Billion
To accurately model the impact on Bitcoin, we must first dissect the source of the capital. The US lottery market is not a monolith; it is a highly optimized, state-sponsored extraction engine targeting specific liquidity pools.
1.1 The Volume of the Flow
According to the North American Association of State and Provincial Lotteries (NASPL), gross lottery sales in the United States totaled \113.3 billion USD in fiscal year 2024.1 This figure represents a robust upward trend, having grown from roughly \80 billion USD in 2020 and \105 billion USD in 2023.2
This \113.3 billion USD figure serves as the Gross Inflow Proxy for our simulation. It represents the total volume of decisions made by consumers to purchase a ticket.
Table 1: US Lottery Sales Trajectory (Billions USD)
| Fiscal Year | Total Sales | YoY Growth | Source |
|---|---|---|---|
| 2020 | \80.1 USD B | - | 2 |
| 2021 | \95.5 USD B | +19.2% | 2 |
| 2022 | \97.9 USD B | +2.5% | 2 |
| 2023 | \103.3 USD B | +5.5% | 2 |
| 2024 | \113.3 USD B | +9.7% | 1 |
1.2 Net Liquidity vs. Gross Churn
A critical distinction must be made between “Gross Sales” and “Net Consumer Losses.”
- The Churn Mechanism: In the lottery system, approximately 60% to 70% of gross revenue is returned to players as prizes.3 For instance, Virginia returns 73.5% and Massachusetts returns 69.4%.3 Players often “churn” these winnings—immediately using a \20 USD win to buy more tickets.
- Net Consumer Expenditure: The actual amount of wealth permanently leaving the consumer class is Gross Sales minus Prizes. With \113.3 billion USD in sales and an estimated ~65% payout ratio, the Net Liquidity extracted is approximately \39.6 billion USD.
Implications for Bitcoin Inflows:
If the behavioral shift is “Instead of buying a ticket, I buy Bitcoin,” two liquidity models emerge:
- The “Sales Volume” Model (\113.3 USDB Inflow): This assumes consumers divert the decision to buy. In a Bitcoin standard, capital is not “paid out” instantly like a lottery prize; it is saved. Therefore, the “churn” stops. The money that would have been re-wagered is instead accumulated. This model represents the maximum behavioral displacement.
- The “Fresh Fiat” Model (\39.6 USDB Inflow): This assumes consumers only have the net cash they were willing to lose. Without lottery winnings to fund further purchases, their purchasing power is limited to their disposable income allocated to gambling.
This report prioritizes the \113.3 billion USD figure as the primary pressure metric, as it reflects the aggregate demand for “hope” or “speculation” that is being re-routed. Even if we adjust for the loss of churned winnings, the initial buying impulse of the US population equates to the gross sales figure.
1.3 Geographic Concentration of Capital
The “Just in USA” impact is heavily weighted by specific jurisdictions. The rotation would not be uniform; it would be driven by “Mega-Whale” states.
- Florida: \9.4 billion USD in annual sales.1
- California: \9.3 billion USD in annual sales.4
- Texas: \8.4 billion USD in annual sales.4
- New York: \8.2 billion USD in annual sales.4
The Massachusetts Anomaly:
Massachusetts represents the highest per-capita lottery spending in the nation at \867 USD per person annually.2 If this specific population cohort—roughly 7 million people—shifted to Bitcoin, they alone would contribute over \6 billion USD in annual buying pressure 5, equivalent to the total inflows of several mid-sized ETFs combined. This suggests that the “Just in USA” impact would be catalyzed by intense, localized buying frenzies in the Northeast and Sunbelt.
2. Bitcoin Market Structure: The Vessel for Inflows
To understand what happens when \113.3 billion USD enters Bitcoin, we must analyze the liquidity conditions of the destination. Bitcoin is an asset characterized by absolute scarcity and increasing illiquidity.
2.1 The Supply Shock Dynamic
Unlike fiat currency or equities with dilutive issuance, Bitcoin’s supply is algorithmically capped.
- Total Supply: ~21 Million (Hard Cap).
- Circulating Supply: ~19.95 Million (as of late 2025).6
- Daily Issuance: Following the 2024 Halving, the block reward is 3.125 BTC. This equates to roughly 450 BTC mined per day. At a hypothetical price of \90,000 USD6, the daily absorption required to maintain price stability is roughly \40.5 million USD.
The Illiquid Supply:
Data from Glassnode indicates that a significant percentage of Bitcoin is held by “Long-Term Holders” (LTHs) who are statistically unlikely to sell.7
- Illiquid Supply: Fidelity Digital Assets and Glassnode estimate that over 28% to 70% of supply is illiquid or locked in corporate treasuries/cold storage.7
- Exchange Balances: Balances on exchanges (the “float” available for sale) have been trending downward, with massive withdrawals (“whale inflows” to custody) signaling accumulation.8
2.2 Order Book Depth and Liquidity
Price is determined at the margins. The relevant metric is not Market Cap, but Market Depth—specifically, how much capital is required to move the price by 1%.
- 1% Market Depth: Analysis of order books (Binance, Coinbase, Kraken) suggests that the “1% depth” (the cost to push price up 1%) typically fluctuates between \100 million USD and \300 million USD globally.9
The Mismatch: Our hypothetical lottery inflow is \310 million USD per day (\113.3 USDB / 365).
- This daily inflow exceeds the 1% market depth of the entire global order book.
- It is 7.6x larger than the daily miner issuance (\40.5 USDM).
Conclusion on Structure:
The Bitcoin market is structurally incapable of absorbing a sustained \310 million USD daily “market buy” order without violent upward price repricing. The order books are too thin, and the new supply is too low.
2.3 The “Crypto Multiplier” Theory
Because of the inelastic supply, money entering Bitcoin has a Multiplier Effect on the Market Capitalization. A \1 USD inflow often results in more than \1 USD of Market Cap growth because the marginal trade reprices the entire stock of 19.9 million coins.
- Bank of America (118x): A 2021 report estimated a multiplier of 118x, suggesting that a net inflow of just \93 million USD could move the price by 1%.10 This is the “Aggressive” model.
- JMP Securities / Glassnode (25x - 50x): In the wake of ETF launches, analysts estimated a multiplier of roughly 25x due to supply constraints.11
- CoinShares (10x): A more conservative estimate used for long-term valuation models.12
This report will utilize these three multipliers to model the “Lottery Shock.”
3. The Inflow Simulation: Modeling the “Lottery Shock”
We now apply the \113.3 billion USD annual inflow to the Bitcoin market using the multiplier frameworks identified above.
3.1 Scenario A: The Conservative Model (10x Multiplier)
This scenario assumes a highly liquid market where sellers (miners, old whales) actively distribute coins into the lottery buyers’ demand, dampening volatility. This aligns with the CoinShares methodology.12
- Annual Inflow: \113.3 USD Billion
- Multiplier: 10x
- Market Cap Increase: \113.3 USDB * 10 = \1.133 USD Trillion
- Price Impact:
- Baseline Market Cap (Late 2025): ~\1.8 USD Trillion (at ~\90,000 USD BTC).6
- New Market Cap: \2.93 USD Trillion.
- Implied Price: ~\147,000 USD per BTC.
Analysis: Even in the most conservative view, replacing lottery tickets with Bitcoin creates a ~63% annual return, pushing the asset well into six-figure territory.
3.2 Scenario B: The Base Case (25x Multiplier)
This scenario reflects the “supply shock” dynamics observed during the 2024 ETF inflows. It assumes that lottery players are “sticky” holders (similar to how they treat tickets—holding for a big win), reducing the sell-side pressure. This aligns with JMP Securities’ analysis.11
- Annual Inflow: \113.3 USD Billion
- Multiplier: 25x
- Market Cap Increase: \113.3 USDB * 25 = \2.83 USD Trillion
- Price Impact:
- New Market Cap: \1.8 USDT + \2.83 USDT = \4.63 USD Trillion.
- Implied Price: ~\233,000 USD per BTC.
Analysis: This scenario suggests a near-tripling of the price. The daily buy pressure of \310 million USD overwhelms OTC desks, forcing them to bid up spot markets aggressively.
3.3 Scenario C: The Liquidity Crisis (BoA 118x Multiplier)
This scenario models a “hyper-illiquidity” event. It assumes the Bank of America regression 10 holds true: that very little supply is actually for sale, and the price must rise exponentially to induce HODLers to part with their coins.
- Annual Inflow: \113.3 USD Billion
- Multiplier: 118x
- Market Cap Increase: \113.3 USDB * 118 = \13.37 USD Trillion
- Price Impact:
- New Market Cap: \1.8 USDT + \13.37 USDT = \15.17 USD Trillion.
- Implied Price: ~\765,000 USD per BTC.
Analysis: In this extreme but modeled scenario, Bitcoin flips Gold (~15T) in a single year solely due to US retail flows. This highlights the fragility of price discovery when massive inelastic demand meets perfectly inelastic supply.
3.4 The “Just in USA” Arbitrage Mechanism
The query emphasizes impact “Just in USA.” However, Bitcoin is a global asset. If US lottery players (via US apps/exchanges like Coinbase, Cash App, Strike) start buying \310 million USD daily, the initial impact is local.
- The Coinbase Premium: The immediate demand shock would occur on US-domiciled order books. The price on Coinbase (BTC/USD) would decouple from Binance (BTC/USDT), potentially trading 1-5% higher.
- Global Arbitrage: Market makers (e.g., Jane Street, Jump Trading) would instantly detect this spread. They would buy BTC in Asia/Europe and sell it into the US bid.
- The Result: The US essentially “exports” its lottery inflation to the Bitcoin network. The US absorbs the global supply of liquid Bitcoin.
- Net Flow: Massive net inflow of BTC into the USA.
- Price: Global price rises to match the US bid (minus friction costs).
- Strategic Implication: The United States populace would rapidly accumulate a dominant percentage of the circulating supply, centralized in the wallets of the working class.
Table 2: Comparative Scenario Summary (Year 1)
| Scenario | Multiplier | Est. Market Cap Increase | Projected Price (From \90 USDk) |
|---|---|---|---|
| Conservative (CoinShares) | 10x | +\1.13 USD Trillion | \147,000 USD |
| Base Case (Glassnode/JMP) | 25x | +\2.83 USD Trillion | \233,000 USD |
| Aggressive (Bank of America) | 118x | +\13.37 USD Trillion | \765,000 USD |
4. Behavioral Economics: The “Lottery Investor” Profile
The quantitative model assumes flow, but the qualitative nature of that flow is equally important. Who are these buyers, and how do they behave?
4.1 Inelasticity and “Diamond Hands”
Lottery demand is regressive and inelastic. Studies show that low-income households spend a significantly higher percentage of their income on lotteries than high-income households.5
Behavioral Trait: Lottery players are accustomed to “losing” the money. They spend \20 USD expecting it to vanish or turn into millions.
Translation to Bitcoin: If this psychology transfers to Bitcoin, these buyers will likely be price-insensitive (buying regardless of whether BTC is \50 USDk or \100 USDk) and sticky (unlikely to panic sell on a 10% drop, as they are used to a 100% loss).
Impact: This creates a new class of “Diamond Hand” investors who treat Bitcoin as a binary bet (Moon or Dust), further restricting liquid supply and supporting the high-multiplier scenarios.
4.2 The Wealth Effect vs. The Churn
Currently, the US lottery system is a wealth destruction engine for the player.
- Current State: \113 USDB spent -> \70 USDB returned (randomly) -> \30 USDB lost to State -> \13 USDB lost to Admin. The aggregate player base loses ~\43 USDB annually.
- Bitcoin State: \113 USDB invested -> Asset retained on balance sheet.
Even in a flat market, the populace retains \113 USDB in equity.
In the Base Case scenario (\233 USDk), the populace sees their \113 USDB grow to roughly \293 billion USD in value.
Macroeconomic Ripple: This shift creates a massive “Wealth Effect” in the lower-middle class. Households with historically zero savings would suddenly possess liquid assets. This could reduce reliance on social safety nets (SNAP, welfare) but also introduces volatility risk to essential household budgets.
5. Socioeconomic & Fiscal Consequences “Just in USA”
The rotation does not happen in a vacuum. The US lottery system is a critical limb of state finance. Amputating it has severe consequences.
5.1 The Crisis of State Revenues
State governments rely on lottery proceeds to fund specific budget line items. In 2023/2024, lottery proceeds (net revenue) contributed approximately \30 billion USD to \35 billion USD to state coffers.2
Dependency by State:
- Florida: Uses lottery funds for the “Bright Futures” scholarship program. Loss of ~\2.5 USDB annual revenue.13
- Pennsylvania: Lottery proceeds fund senior citizen programs (property tax rebates, transit). Loss of ~\1.5 USDB annual revenue.4
- West Virginia / Rhode Island: Extremely high dependency, with lottery making up 3-7% of total state tax revenue.2
The Fiscal Cliff:
If \113 billion USD moves to Bitcoin, states lose \35 billion USD in “voluntary tax” revenue.
- Immediate Impact: Budget deficits in 45 states.
- Response: States would be forced to raise Sales Tax, Property Tax, or Income Tax to fill the hole. This essentially shifts the burden from “voluntary gamblers” to the general taxpayer.
5.2 Capital Gains: The Delayed Offset
While states lose lottery revenue, they gain potential Capital Gains Tax revenue.
If the US populace holds \2.8 trillion USD in Bitcoin profit (Base Case), that represents a taxable event upon sale.
The Problem: The “Lottery HODLer” might not sell for years. Lottery revenue is immediate; Capital Gains revenue is deferred. This creates a liquidity gap that could bankrupt municipal programs in the interim.
6. Detailed Liquidity Analysis & “Just in USA” Pricing Isolation
We must address the specific prompt constraint: “impact… just in USA.”
6.1 The “Coinbase Premium” Phenomenon
Historically, when US retail demand surges (e.g., during the 2021 bull run), the price on Coinbase Pro (USD pair) trades higher than on Binance (USDT pair).
- Mechanism: The lottery inflow is strictly USD-denominated and originates from US banking rails (ACH/Wire).
- Effect: This buying pressure hits the BTC/USD pair first.
- Quantification: If \310 million USD/day hits Coinbase, and arbitrageurs are slow (due to banking limits), the Coinbase Premium could sustain at 100-500 basis points (1-5%).
- Result: “Bitcoin Price just in USA” would functionally be higher than the rest of the world. A Bitcoin might cost \235,000 USD in New York, while trading for \230,000 USD in Tokyo.
6.2 OTC Desk Depletion
Institutional OTC desks (e.g., Cumberland, Genesis, NYDIG) act as buffers. They hold inventory to service large buy orders.
- Inventory Drain: A persistent \310 million USD daily retail bid would drain OTC inventories within weeks.
- Forced Spot Buying: Once OTC desks are empty, they must replenish by buying on public spot markets. This effectively removes the “buffer” between retail demand and price discovery, leading to slippage and vertical price candles.
Table 3: Estimated 1% Market Depth vs. Lottery Inflow
| Exchange | Est. 1% Bid Depth (USD) | Lottery Daily Inflow | Ratio |
|---|---|---|---|
| Coinbase | ~\35 USD Million | N/A | - |
| Binance | ~\70 USD Million | N/A | - |
| Global Agg. | ~\200 USD Million | \310 USD Million | 1.55x |
Interpretation: The daily lottery inflow is 1.55 times larger than the global 1% depth. This implies that without massive new sell orders appearing, the price would mechanically rise by >1% every single day.
7. Conclusion: The Asymmetric Shock
The simulation of replacing US lottery tickets with Bitcoin purchases reveals a scenario of extreme financial asymmetry.
- Price Asymmetry: The relatively small global Bitcoin market (compared to equities or real estate) is unprepared for a \113 billion USD annual persistence shock. Even modest multiplier models predict a price floor exceeding \140,000, USD with probable targets in the \230,000 USD+ range.
- Wealth Asymmetry: The rotation would execute a historic transfer of ownership. The “Just in USA” nature of the flow means that within 3-5 years, the US working class could control a supermajority of the global Bitcoin supply, effectively cornering the market of the premier digital collateral.
- Fiscal Asymmetry: The US public sector (State Governments) would face immediate insolvency in discretionary budgets, while the private sector (Households) would experience a massive, albeit volatile, balance sheet expansion.
In essence, if the “idiot tax” of the lottery became the “savings plan” of the Bitcoin network, the impact would be the rapid demonetization of state lotteries and the simultaneous remonetization of Bitcoin at a valuation rivaling Gold.
(Note: This report utilizes data from NASPL 2024 reports1, Glassnode On-Chain Analytics14, and multiplier methodologies from Bank of America10, CoinShares12, and JMP Securities.11)
Tips and Donations
If you enjoyed this deep dive, consider supporting the project with a tip in Sats. It’s a simple, global way to support independent research.
To send Sats, you’ll need a lightning wallet.
References
-
North American Association of State and Provincial Lotteries (NASPL). (2025). 2024 Annual Report. ↩ ↩2 ↩3 ↩4 ↩5
-
LaVigne, C. (2024, August 27). A Year of Adjustment for Lotteries. NASPL Insights. ↩ ↩2 ↩3 ↩4 ↩5 ↩6 ↩7 ↩8 ↩9
-
(2023). Comprehensive Annual Financial Report for the Fiscal Year Ended June 30, 2023. Virginia Lottery. ↩ ↩2
-
(2024). State Lottery Revenue and Spending. Urban Institute. ↩ ↩2 ↩3 ↩4
-
Kearney, M. S. (2005). The Economic Winners and Losers of Legalized Gambling. National Bureau of Economic Research. ↩ ↩2
-
Crypto Market Depth. (2024). Kaiko. ↩
-
Bank of America. (2021, March). Bitcoin’s Dirty Little Secrets. ↩ ↩2 ↩3
-
JMP Securities. (2024). JMP Securities Initiates Coverage of the Crypto Economy. ↩ ↩2 ↩3
-
CoinShares. (2024). Bitcoin Valuation by Savings Adoption. ↩ ↩2 ↩3
-
Bright Futures Scholarship Program. (2024). Florida Department of Education. ↩