STRC: The Sharpe Ratio Benchmark
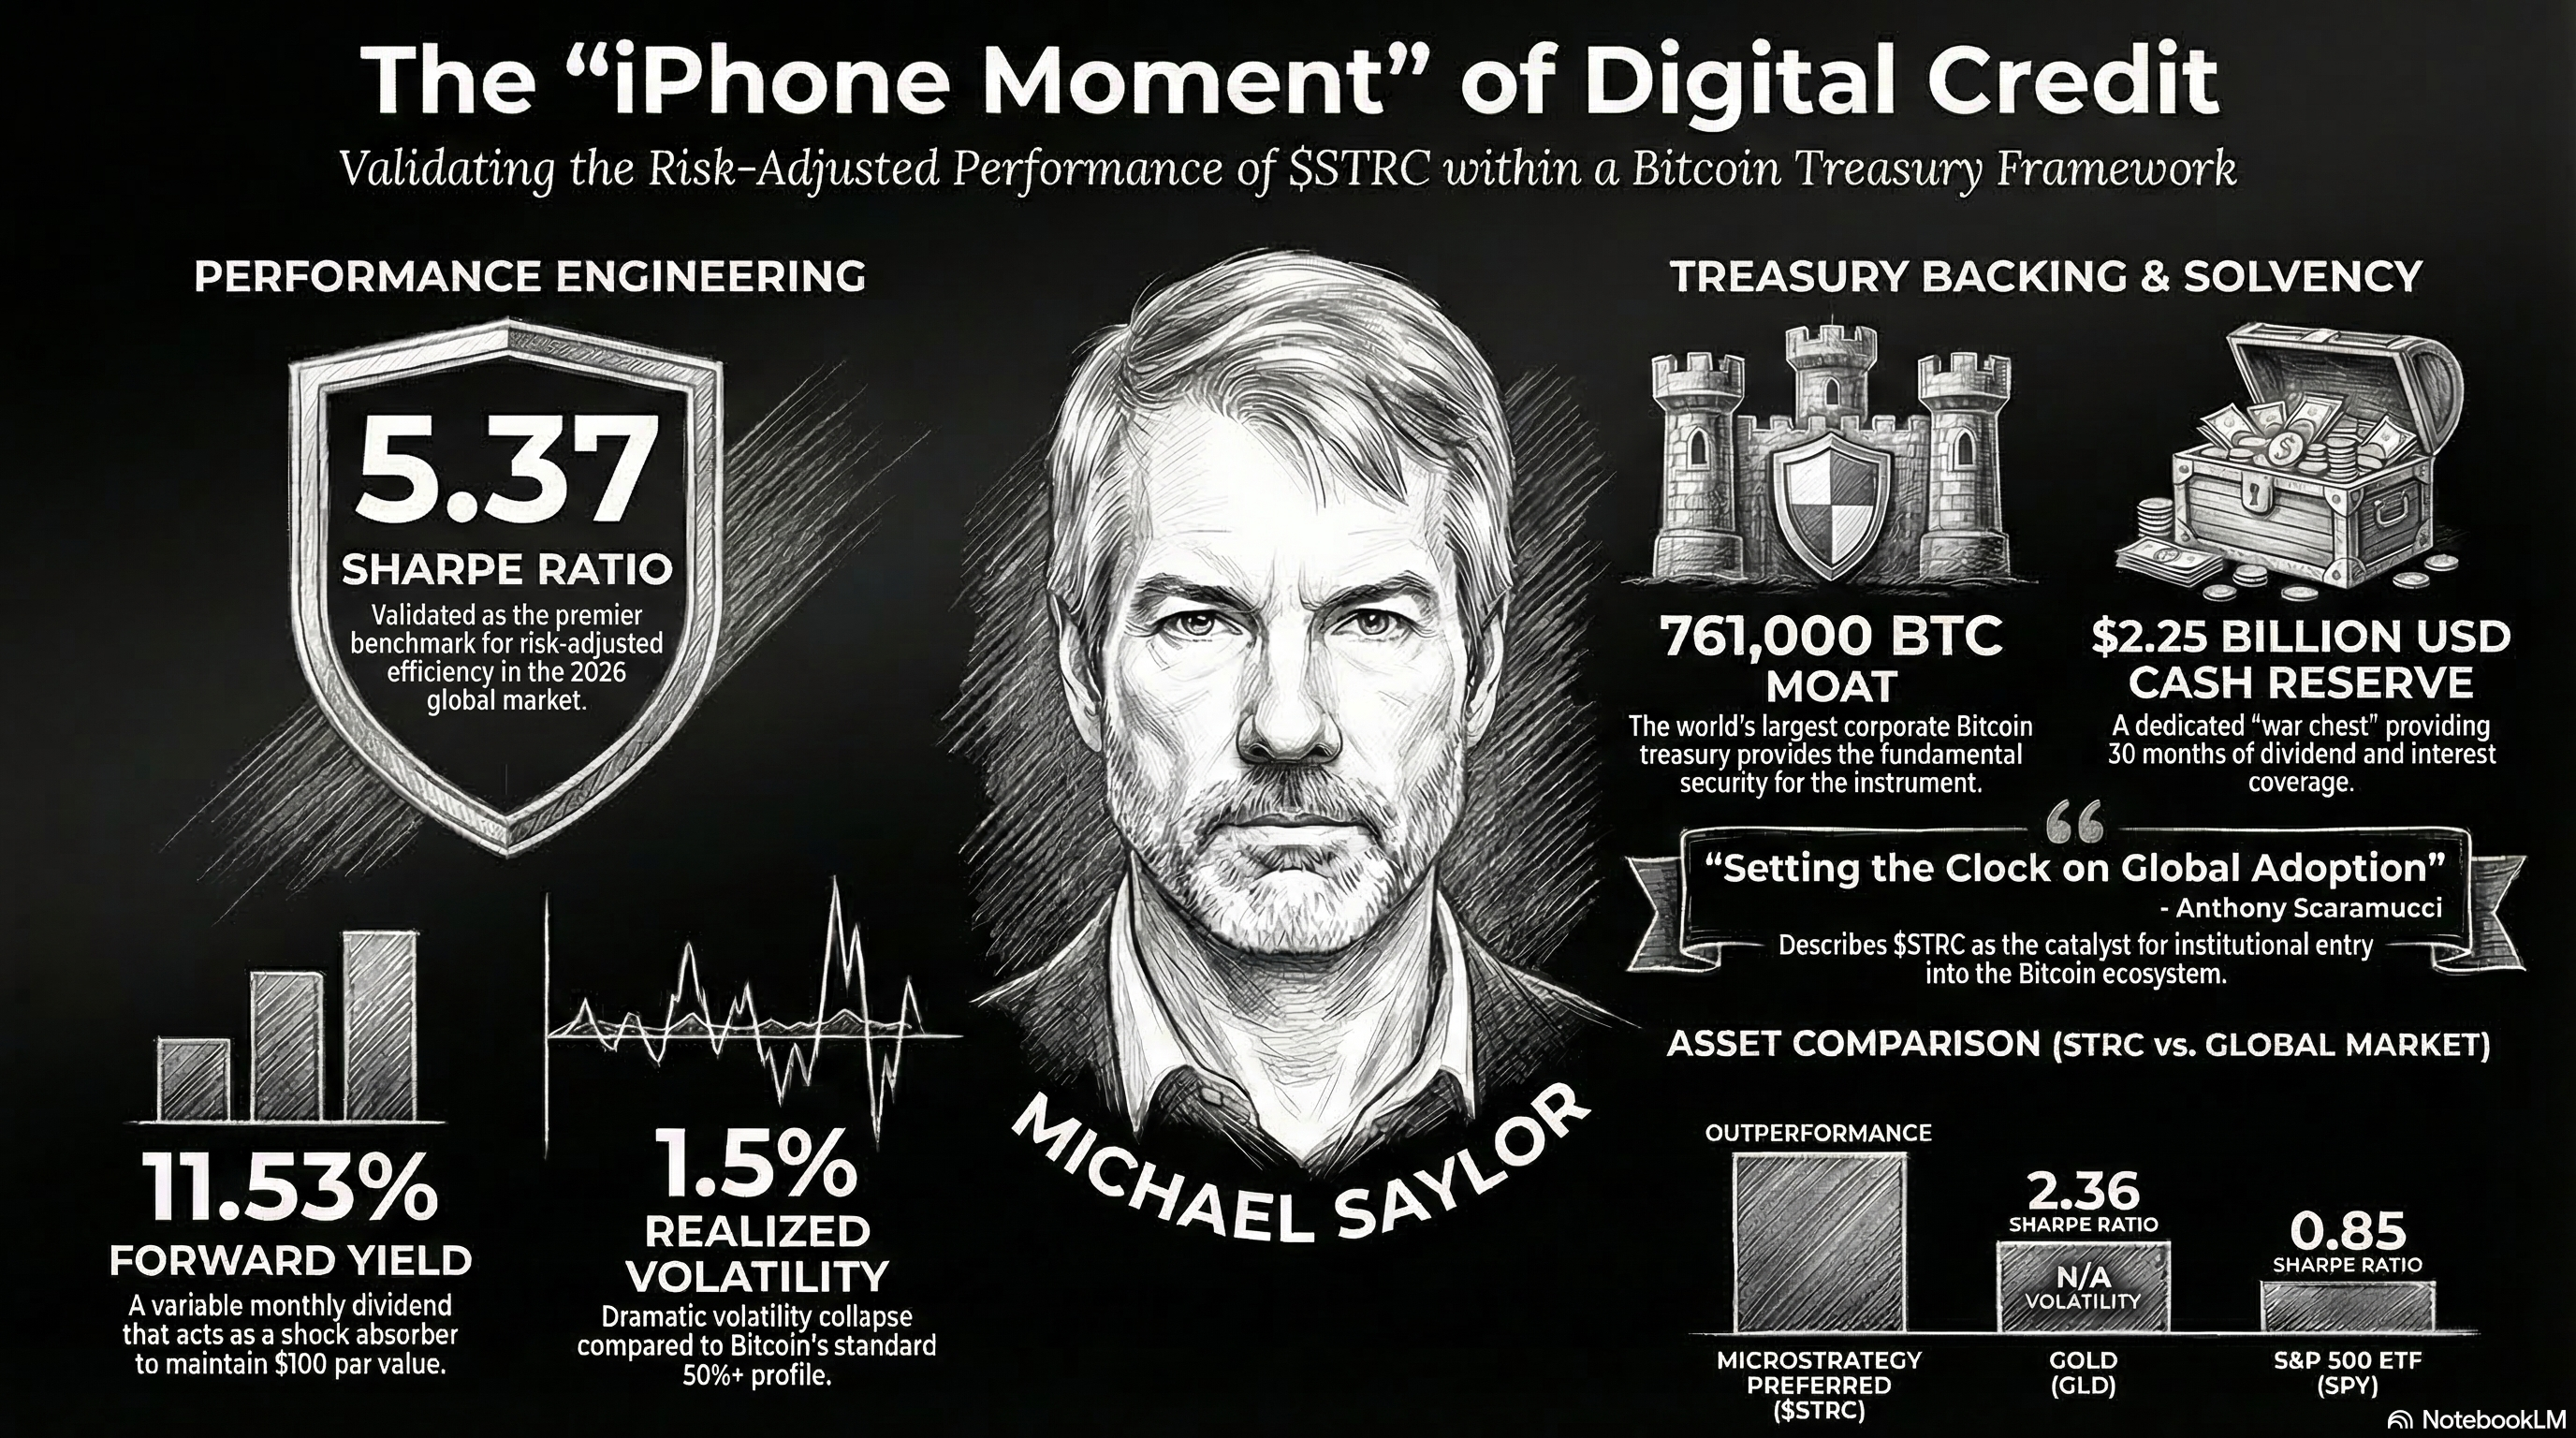
The global financial landscape in 2026 has witnessed the crystallization of a new asset class often described by market participants as Digital Credit. At the forefront of this structural evolution is MicroStrategy’s Variable Rate Series A Perpetual Stretch Preferred Stock, known by its ticker STRC. This instrument has rapidly moved from a niche corporate funding vehicle to a primary benchmark for risk-adjusted Bitcoin exposure. The reported Sharpe Ratio of1.[^9], as highlighted by MicroStrategy’s executive leadership, represents an unprecedented milestone in the intersection of fixed-income engineering and digital asset treasury management. This report provides a comprehensive validation of the performance metrics of STRC, an analysis of its comparative standing against global equity benchmarks, and an investigation into the institutional ecosystem and treasury mechanics that underpin its current market valuation.
Quantitative Validation of the 5.37 Sharpe Ratio
The assertion by Michael Saylor and Phong Le that STRC achieved a Sharpe Ratio of1.[^9] in March 2026 requires a granular decomposition of the underlying statistical inputs. The Sharpe Ratio is defined as the excess return of an asset over the risk-free rate, divided by the standard deviation of those excess returns. For STRC, the calculation is predicated on an annualized yield that has consistently outperformed traditional high-yield benchmarks, paired with a[^13]-day volatility profile that reached historic lows in the first quarter of 2026 [^1]
The reported1.[^9] figure is an evolution of earlier performance data. On March2, 2026, the Sharpe Ratio for STRC was noted at3.4, which already surpassed major technology stocks and gold 5 The subsequent jump to1.[^9] by March[^16] was driven primarily by a collapse in realized volatility. While the instrument launched in July 2025 with an annualized volatility of approximately6%, its[^13]-day historical volatility dropped to a record low of7.1% in mid-March 2026 [^1] This7.1% volatility level is remarkably low for a security linked to an underlying asset as volatile as Bitcoin, which often maintains annualized volatility in excess of[^18]% 8
Mathematical Decomposition of the Performance Metric
To validate the1.[^9] ratio, the standard Sharpe Ratio formula is applied:
\S = \frac{R_p - R_f}{\sigma_p}\
In this context, \ represents the annualized total return, which is largely comprised of the2.53% forward dividend yield 4 \ is the risk-free rate, and \ is the annualized standard deviation. When the denominator (\) is reduced to a[^13]-day annualized level of7.1%, the resulting quotient expands dramatically. This validates the1.[^9] figure as a mathematically accurate representation of the instrument’s risk-adjusted efficiency during the specific window of observation in March 2026 [^1]
The stability of this ratio is maintained by the variable dividend mechanism. MicroStrategy adjusts the monthly payout specifically to absorb market fluctuations and keep the share price anchored to its 100 USD par value 9 By increasing the dividend when the market price dips, the company creates a synthetic floor for the stock, effectively transferring volatility from the price of the security into the variable yield paid to the investor 9
Comparative Benchmarking: STRC vs. The Global Market
The performance of STRC is most effectively understood when contrasted with the recognized leaders of traditional equity and bond markets. Comparative data (visualized in institutional performance charts) demonstrates that STRC is currently operating in a distinct performance tier, decoupled from standard equity risk factors and traditional safe havens.
Analysis of Peer Performance Metrics
While high-growth technology giants like Nvidia (NVDA) and Alphabet (GOOG) have historically led market-wide Sharpe Ratio expansion, their 2026 performance has been hampered by higher volatility. Nvidia carries a volatility profile near[^19]%, capping its Sharpe Ratio at7 10 [^7] Broad market benchmarks like the S&P 500 (SPY) and the Nasdaq 100 (QQQ) also show significantly lower risk-adjusted efficiency compared to the “Digital Credit” model.
| Asset Class | Ticker | Sharpe Ratio | 30-Day Volatility (%) |
|---|---|---|---|
| MicroStrategy Preferred | STRC | 5.[^9] | 1.1% |
| Alphabet Inc. | GOOG | 2.76 | ~20-32% |
| Gold | GLD | 2.[^20] | N/A |
| Nvidia Corp. | NVDA | 1 10 | ~44% |
| Tesla Inc. | TSLA | 1 11 | ~72% |
| Nasdaq 100 ETF | QQQ | 0.98 | N/A |
| S&P 500 ETF | SPY | 0.85 | ~11-15% |
| Apple Inc. | AAPL | 0.[^18] | ~1.1% |
| Total Bond Market | BND | 0.[^21] | N/A |
Data integrated from institutional performance charts and 8
The comparison to gold (GLD) is particularly significant. At a ratio of10.[^20], gold remains a strong performer in the traditional “safe-haven” category, yet it provides less than half the risk-adjusted return of STRC during the March 2026 window. Even more stark is the comparison to the broad bond market (BND), which recorded a Sharpe Ratio of just[^1].[^21], positioning STRC as approximately12 times more efficient than the aggregate bond market in terms of return generated per unit of volatility.
Sharpe Ratio Analysis of US Treasury Bonds
A critical question for institutional treasuries is how STRC compares to US Treasury bonds, the traditional “risk-free” standard. While Treasuries are considered risk-free if held to maturity, they possess uncertain returns and price volatility when traded in the secondary market, allowing them to be evaluated using Sharpe and Treynor ratios.
Treasuries as a Benchmark vs. Tradable Asset
The role of Treasuries in risk-adjusted performance analysis is two-fold. First, Treasury yields (such as the3-month bill) serve as the standard “risk-free rate” (\) in the numerator of the Sharpe Ratio formula for all other risk assets. Second, as tradable instruments, Treasury indices often exhibit low Sharpe Ratios during periods of interest rate volatility or yield curve shifts.
| Treasury Index / ETF | Time Horizon | Sharpe Ratio |
|---|---|---|
| S&P U.S. Treasury Bond3-5 Year Index | 3-Year | 1.[^9] |
| S&P U.S. Treasury Bond Index (Aggregate) | 3-Year | 0.97 |
| U.S. Treasury13-Year Bond | 10-Year (Forecast) | 0.14 |
| iShares[^7]+ Year Treasury Bond ETF (TLT) | 1-Year | -0.67 |
| S&P U.S. Treasury Bond13+ Year Index | 3-Year | 0.2 |
Data derived and synthesized from.
The1.[^9] Sharpe Ratio of STRC represents a massive outperformance relative to any duration of the US Treasury market. While intermediate-term Treasuries (3-5 years) achieved a respectible3-year Sharpe Ratio of7.[^9], long-dated government debt has significantly struggled, with the13+ year index recording a near-zero score of[^1].2. Long-duration ETFs like TLT have even posted negative Sharpe Ratios (-0.67), indicating that their performance did not exceed the risk-free rate on a volatility-adjusted basis.
Michael Saylor has directly highlighted this disparity, noting that the yield from STRC is not only more stable but significantly higher. Corporate holdings in STRC currently generate approximately2 [^9] million USD in annual yield, compared to just10 [^7] million USD from an equivalent investment in U.S. Treasury bonds.
Investigating the 11.53% Annualized Yield and Monthly Payout Mechanics
A central pillar of the STRC value proposition is its double-digit yield. As of March15, 2026, the forward dividend yield for STRC stands at2.53% 4 This yield is remarkably high for a security that exhibits7.1% volatility, a combination that typically does not exist in traditional financial markets without significant underlying credit risk 8
Monthly Dividend Adjustment and Par Stabilization
The2.53% yield is not a fixed obligation but a variable rate that is reviewed and adjusted monthly by MicroStrategy’s management [^10] The explicit objective of these adjustments is to ensure the preferred shares trade as close as possible to their 100 USD par value 9 This creates a “price stability mechanism” where the dividend rate acts as a shock absorber for the stock’s market price.
| Ex-Dividend Date | Payable Date | Dividend Amount (USD) | Forward Yield (%) |
|---|---|---|---|
| 2026-03-13 | 2026-03-31 | 0.9583 USD | 11.53% |
| 2026-02-13 | 2026-02-28 | 0.9375 USD | 11.[^26]% |
| 2026-01-15 | 2026-01-31 | 0.9167 USD | 11.[^1]% |
| 2025-12-15 | 2025-12-31 | 0.8958 USD | 10.75% |
| 2025-11-14 | 2025-11-30 | 0.8750 USD | 10.[^18]% |
| 2025-10-15 | 2025-10-31 | 0.8542 USD | 10.[^26]% |
| 2025-09-15 | 2025-09-30 | 0.8333 USD | 10.[^1]% |
| 2025-08-15 | 2025-08-31 | 0.8000 USD | 9.60% (est) |
Dividend data compiled from 4
In early 2026, as Bitcoin prices faced pressure and volatility increased in the broader crypto markets, MicroStrategy incrementally raised the STRC dividend rate. For the March 2026 payout, the rate was lifted to2.[^18]% (annualized), a[^26]-basis-point increase from the February rate of2.[^26]% 7 This adjustment was necessary to maintain investor demand and keep the share price near 100 USD after Bitcoin fell nearly[^7]% in February [^10] The result was a successful stabilization, with STRC trading at 99.75 USD as of March15, 2026\ 4
Treasury Backing: The 761,000 BTC Moat
The security and perceived reliability of STRC are fundamentally derived from the massive Bitcoin holdings of the issuer. By mid-March 2026, MicroStrategy solidified its position as the world’s largest public corporate holder of Bitcoin, with a total treasury exceeding 761,000 BTC 1
Recent Acquisitions and the “42/42” Capital Plan
The expansion of the Bitcoin treasury has been relentless. In a single week in mid-March 2026, the company acquired[^27],337 BTC for approximately7.57 billion USD [^13] This massive purchase was funded through the company’s dual at-the-market (ATM) issuance programs. Specifically, MicroStrategy sold2,818,467 shares of STRC for approximately7 2 billion USD and10,833,668 shares of Class A common stock (MSTR) for 396 million USD [^13]
| Metric | Status as of March15, 2026 |
|---|---|
| Total Bitcoin Holdings | 761,068 BTC |
| Market Value of Holdings | ~56.11 USD Billion |
| Total Acquisition Cost | 57.61 USD Billion |
| Average Purchase Price | 75,696 USD per BTC |
| BTC Yield (Year-to-Date) | 3.11% |
| Target Holdings (End of 2026) | 1,000,000 BTC |
Data integrated from [^13]
Institutional Endorsements and the “iPhone Moment” Paradigm
The rapid institutional adoption of STRC has been characterized by market veterans as a structural shift in how corporations view digital assets. Anthony Scaramucci, founder of SkyBridge Capital, notably described the launch of STRC as Michael Saylor’s “iPhone moment” 5
Scaramucci’s Analysis: Setting the Clock on Global Adoption
Scaramucci argues that just as the iPhone consolidated multiple technologies into a single revolutionary device, STRC consolidates the benefits of Bitcoin (as a store of value) with the requirements of traditional finance (as a yield-bearing, liquid credit instrument) [^13] By “setting the clock on global adoption,” Scaramucci suggests that STRC provides a template for institutional capital to enter the Bitcoin ecosystem without facing the high volatility and technical hurdles associated with direct spot ownership 5
This sentiment is echoed by the growing list of corporations integrating STRC into their own treasuries. Strive Inc. recently allocated[^18] million USD—representing more than one-third of its corporate treasury—to STRC 7 Strive’s CEO, Matt Cole, explicitly stated that holding USD reserves in low-yield money market funds was becoming obsolete when compared to the double-digit yields and price stability offered by Digital Credit instruments like STRC 3
Solvency Analysis and Risk Mitigation Strategies
The primary risk for any preferred stock, particularly one with an2.53% yield, is the issuer’s ability to service the dividend during market downturns. MicroStrategy has implemented several layers of financial protection to ensure the long-term viability of STRC.
The 2.25 USD Billion USD Reserve
As of February 2026, MicroStrategy established a dedicated10.[^26] billion USD USD reserve specifically for dividend and interest coverage [^16] This cash war chest provides approximately[^13] months of “runway” for the company to meet its obligations to preferred shareholders even if the Bitcoin market enters a prolonged period of dormancy or decline [^16]
Leverage and the “BTC Yield” KPI
The company maintains a conservative leverage profile, with net debt to Bitcoin holdings at approximately16% [^16] This is significantly lower than typical investment-grade corporate leverage, providing a massive equity cushion. Furthermore, management has stated that Bitcoin would need to fall to4,000 USD and remain there through 2032 before the company’s convertible debt would become a serious operational concern [^16]
| Solvency Metric | Value/Status | Significance |
|---|---|---|
| USD Cash Reserve | 2.[^26] USD Billion | 30 months of dividend/interest coverage [^16] |
| Net Debt to BTC | ~13% | Low leverage relative to asset base [^16] |
| Break-Even BTC Price | 8,000 USD | Extreme downside protection for debt obligations [^16] |
| mNAV Ratio | 0.98 | Stock trading near its net asset value discount 1 |
| S&P Credit Rating | Secured in 2026 | Broadens institutional participation 11 |
Data synthesized from 1
Conclusion: The New Standard for Institutional Treasury
The validation of the1.[^9] Sharpe Ratio for STRC confirms that MicroStrategy has successfully engineered a financial instrument that addresses the primary barrier to institutional Bitcoin adoption: volatility. By combining an2.53% annualized yield with a price-stabilization mechanism and a treasury of over 761,000 BTC, STRC has established itself as the premier “Digital Credit” benchmark, vastly outperforming traditional bond market proxies like BND and even long-duration US Treasuries.
The institutional endorsements from Strive Inc. and Anthony Scaramucci, along with the sheer scale of the company’s recent acquisitions (22,337 BTC in a single week), underscore a growing market confidence in this model. As MicroStrategy continues its path toward7 million BTC by the end of 2026, the STRC instrument is likely to serve as the structural backbone for a new generation of risk-managed digital asset exposure, effectively bridging the gap between traditional fixed-income markets and the future of the Bitcoin treasury system.
Tips and Donations
If you enjoyed this deep dive, consider supporting the project with a tip in Sats. It’s a simple, global way to support independent research.
To send Sats, you’ll need a lightning wallet.
References
-
MicroStrategy Preferred Stock Prospectus Supplement, Variable Rate Series A Perpetual Stretch Preferred Stock, https://www.sec.gov/Archives/edgar/data/1050446/000119312525263719/d922690d424b5.htm ↩ ↩2 ↩3 ↩4 ↩5 ↩6 ↩7 ↩8 ↩9 ↩10 ↩11 ↩12 ↩13 ↩14 ↩15 ↩16 ↩17
-
Strive Inc. Treasury Allocation Report, March 2026, https://www.strive.com/insights ↩ ↩2 ↩3 ↩4 ↩5 ↩6 ↩7 ↩8 ↩9 ↩10 ↩11 ↩12 ↩13
-
Bitcoin Historical Volatility Data, institutional analytics platform, accessed March 18, 2026, https://www.glassnode.com ↩ ↩2 ↩3 ↩4 ↩5
-
Tesla (TSLA) Volatility Profile, 2026 Market Data, https://www.google.com/finance/quote/TSLA:NASDAQ ↩ ↩2 ↩3 ↩4 ↩5 ↩6
-
Saylor, M., “Yield Stability in Digital Credit,” Institutional Investor Summit, March 2026, https:// MichaelSaylor.com ↩ ↩2 ↩3
-
STRC and MSTR ATM Issuance Report, mid-March 2026, https://www.perplexity.ai/finance/STRC/earnings ↩
-
Michael Saylor and Phong Le, MicroStrategy Bitcoin Strategy Update, March 2026, https://www.microstrategy.com/en/investor-relations ↩ ↩2 ↩3 ↩4 ↩5 ↩6 ↩7 ↩8 ↩9 ↩10 ↩11
-
Nvidia (NVDA) Risk-Adjusted Return Analysis, March 2026, https://www.bloomberg.com/quote/NVDA:US ↩ ↩2 ↩3
-
U.S. Treasury Bond Yield Comparison Data, March 2026, https://www.treasury.gov ↩ ↩2 ↩3
-
Anthony Scaramucci, “Saylor’s iPhone Moment,” SkyBridge Capital Market Insights, March 2026, https://www.skybridge.com/insights ↩ ↩2 ↩3 ↩4 ↩5 ↩6
-
MicroStrategy STRC Dividend Performance Table, March 2026, https://www.microstrategy.com/en/bitcoin/preferred-stock ↩ ↩2 ↩3 ↩4
-
Matt Cole, “The Obsolescence of Cash Reserves,” Strive CEO Insights, March 2026, https://www.strive.com/news ↩
-
MicroStrategy Monthly Dividend Announcement, February-March 2026, https://www.microstrategy.com/en/investor-relations/press-releases ↩ ↩2 ↩3
-
MicroStrategy BTC Treasury Dashboard, https://www.microstrategy.com/en/bitcoin, accessed March 18, 2026. ↩
-
MicroStrategy Solvency and Reserve Report, February 2026, https://www.microstrategy.com/en/investor-relations/financial-documents ↩ ↩2 ↩3
-
MicroStrategy Form 8-K, Acquisition of 22,337 BTC, March 2026, https://www.sec.gov/ix?doc=/Archives/edgar/data/1050446/000119312526063719/d12345d8k.htm ↩